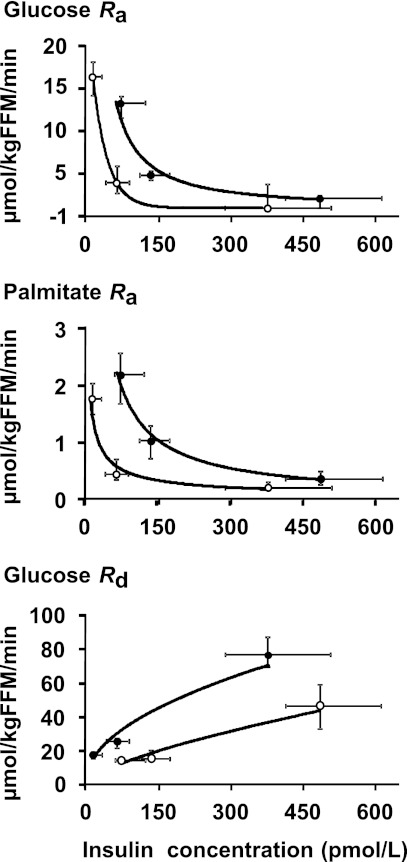
Figure 3.
Correlation between systemic plasma insulin concentration and substrate kinetics in lean (○; n = 26) and obese (●; n = 14) subjects. A: Glucose Ra (R2 = 1 and R2 = 0.968, respectively). B: Palmitate Ra (R2 = 0.9486 and R2 = 0.988, respectively). C: Glucose Rd (R2 = 0.957 and R2 = 0.932, respectively). Values are medians and interquartile ranges.

