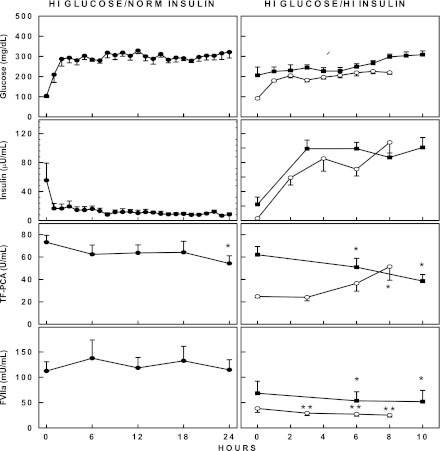
Figure 2.
Left columns: Plasma glucose and serum insulin concentrations, circulating TF-PCA, and FVIIa activity before and during 24 h of selective hyperglycemia in seven patients with T1DM. Shown are means ± SE. Statistical analysis: *P < 0.02 compared with 0 h. Right columns: Plasma glucose, serum insulin, circulating TF-PCA, and FVIIa levels before and during 10 h of combined hyperglycemia plus hyperinsulinemia in eight patients with T1DM and in seven nondiabetic control subjects (open circles). Shown are means ± SE. Statistical analysis: TF-PCA *P < 0.01 compared with baseline. FVIIa: *P < 0.05; **P < 0.01 compared with baseline.

