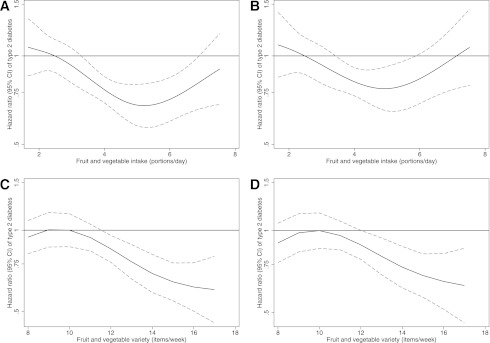
Figure 1.
The upper percentile of the first tertile for quantity and variety of F&V intake was used as the reference category. A: The association between quantity of F&V intake and HR (95% CI) of diabetes adjusted for sex, BMI, waist circumference, education level, Townsend Deprivation Index, occupational social class, physical activity level, smoking status, family history of diabetes, total energy intake, and season. B: Same as A but additionally adjusted for variety of F&V intake. C: The association between variety of F&V intake and HR (95% CI) of diabetes adjusted for sex, BMI, waist circumference, education level, Townsend Deprivation Index, occupational social class, physical activity level, smoking status, family history of diabetes, total energy intake, and season. D: Same as C but additionally adjusted for quantity of F&V intake.

