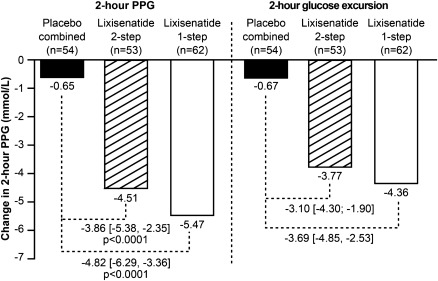
Figure 2.
Changes in postbreakfast glucose parameters from baseline after 12-weeks' treatment with lixisenatide (according to dose increase regimen) or placebo. LS mean change in mean (±SEM) 2-h PPG levels is shown. LS mean change in 2-h glucose excursion is also shown. Data are from patients undergoing a standardized breakfast meal test at selected sites. Glucose excursion = 2-h PPG, plasma glucose 30 min before the meal test before study drug administration. Mean ± SD baseline values for 2-h PPG: 13.99 ± 4.78 mmol/L (placebo), 14.67 ± 3.78 mmol/L (lixisenatide 2-step), 14.55 ± 3.36 mmol/L (lixisenatide 1-step). Mean ± SD baseline values for glucose excursion: 4.72 ± 3.65 mmol/L (placebo), 5.45 ± 3.02 mmol/L (lixisenatide 2-step), 5.25 ± 2.89 mmol/L (lixisenatide 1-step). To convert mmol/L to mg/dL, divide by 0.0555.

