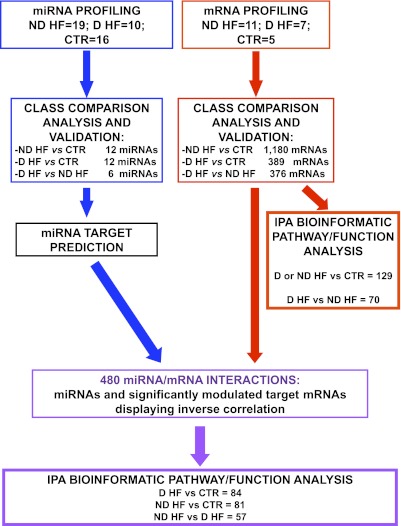
FIG. 1.
Experimental plan. miRNA (blue) and mRNA (red) expression profiles were determined, and class comparison analysis identified significantly modulated miRNAs and mRNAs in the indicated classes of patients. Validation was performed by qRT-PCR for both miRNAs and mRNAs. IPA was used to analyze the molecular pathways and functions enriched among the differentially expressed mRNA (far right branch). For the miRNAs identified by class comparison, target mRNAs were predicted by dedicated software. Next, predicted target datasets were intersected with significantly modulated mRNAs deriving from class comparison analysis. Only miRNA/mRNA couples displaying inverse significant correlations were selected (purple) and further analyzed by IPA.

