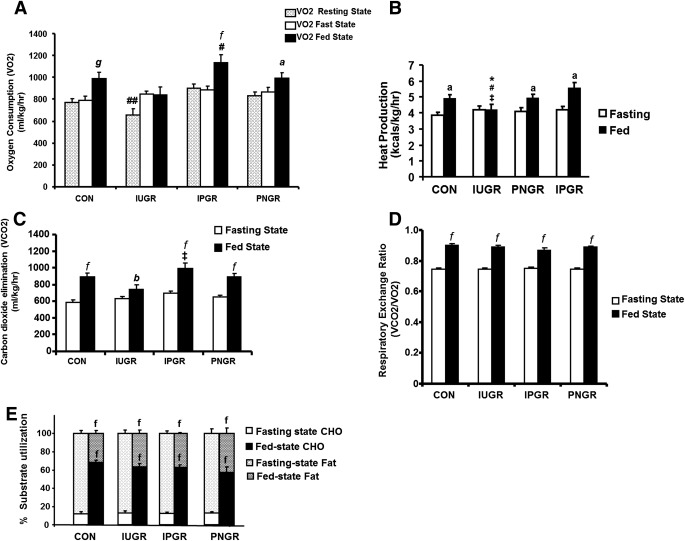
FIG. 3.
A: VO2. B: Heat production. C: Vco2. D: RER. E: Percent use of substrates carbohydrate (CHO) and fat is shown in IUGR, IPGR, PNGR, and CON groups during fasting and fed states (n = 6 in each group). Fasting vs. fed states in the respective groups: aP < 0.01, bP < 0.02, fP < 0.001, gP < 0.003. #P < 0.001 Vo2 fed-state IPGR vs. fasting and fed states in IUGR group. ##P < 0.05 resting-state Vo2 IUGR vs. resting-state Vo2 IPGR. *P < 0.03 heat production during fed state in the IUGR vs. the fed state in CON. #P < 0.0003 heat production during fed state in the IUGR vs. fed state in CON. ‡P < 0.02 heat production during fed state in PNGR vs. fed state in IUGR. ‡P < 0.001 Vco2 fed state in IPGR vs. fed state in IUGR.

