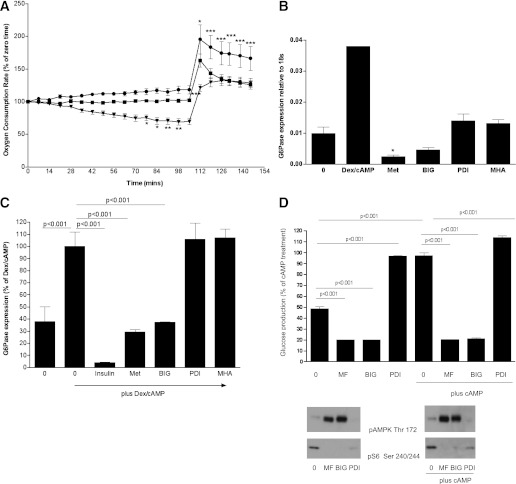
FIG. 4.
Effect of biguanides and PDI on mitochondrial respiration, gluconeogenesis, and glucose production. A: H4IIE cells were grown in serum-free medium overnight followed by stimulation without (squares) or with metformin (inverted triangles) or PDI (circles) as indicated. Cells were treated with drug 1 h before measurements started. Using a Seahorse analyzer (Seahorse Bioscience), OCR was measured. At 105 min, 100 μM 2,4 dinitrophenol was added to uncouple the electron transport chain from control by ATP synthesis in order to reveal the maximal respiration rate. There were no statistically significant differences in OCR between different treatment groups at time zero. Data are normalized to 100 at the start of the experiment. Statistical analysis was carried out as in Fig. 1D, except that a two-way ANOVA was performed. B and C: H4IIE cells were grown for 3 days, then serum-starved overnight, followed by stimulation for 8 h with or without 500 nM dexamethasone (Dex)/100 μM CPT-cAMP, coincubated with 10 nM insulin or the metformin analogs shown (2 mM of each, abbreviations are as in the main text). Expression of G6Pase was measured by RT-PCR, using conditions described in research design and methods. Statistical analysis was carried out as in Fig. 1D. D: Primary hepatocytes were treated with or without 2 mM metformin (MF), 5 mM BIG, or 5 mM PDI for 12 h with or without 100 μM Bt2-cAMP and glucose production was measured as described in research design and methods. The cells were lysed and effects of the drugs on cell signaling verified by Western blotting (bottom). Statistical analysis was carried out as in Fig. 1D. *P < 0.05, **P < 0.01, ***P < 0.001.

