FIG. 6.
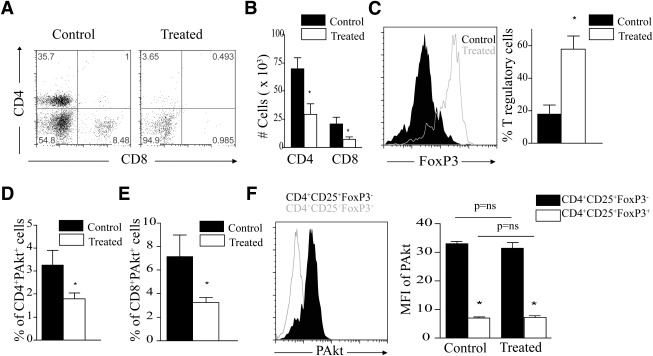
A: Representative example of FACS staining of cells isolated from pancreas of NOD mice treated with either AS605240 or PBS vehicle for 3 weeks. Dot plots show gating on CD4+ and CD8+ T cells. B: The bar graph represents the absolute number of CD4+ and CD8+ T cells in the PI3Kγ-i–treated mice compared with control (*P < 0.05; n = 3 to 4 mice in each group). C: Representative example of FACS staining of cells isolated from pancreas of NOD mice treated with either AS605240 or PBS vehicle. Cells are gated on CD4+ T cells and show FoxP3 expression. Bar graph represents the percentage of Tregs in cells isolated from pancreas of PI3Kγ-i–treated mice compared with control PBS-treated NOD mice (*P < 0.05; n = 3 to 4 mice in each group). D: Bar graph represents the percentage of CD4+ T cells highly expressing PAkt by flow cytometry in spleens of PI3Kγ-i–treated mice compared with control PBS-treated mice (*P < 0.05; n = 3 to 4 mice in each group). E: Bar graph represents the percentage of CD8+ T cells highly expressing PAkt (*P < 0.05; n = 3 to 4 mice in each group). F: Representative example of FACS staining of PAkt expression in CD4+CD25+FoxP3+ Tregs compared with CD4+CD25+FoxP3− non-Tregs in splenocytes of treated NOD mice. Bar graph shows the mean fluorescence intensity (MFI) of PAkt expression in CD4+CD25+FoxP3+ Tregs compared with CD4+CD25+FoxP3− non-Tregs in splenocytes of NOD mice treated with either AS605240 or PBS vehicle (control) (*P < 0.05; n = 3 to 4 mice in each group). Results are presented as the mean ± SEM.

