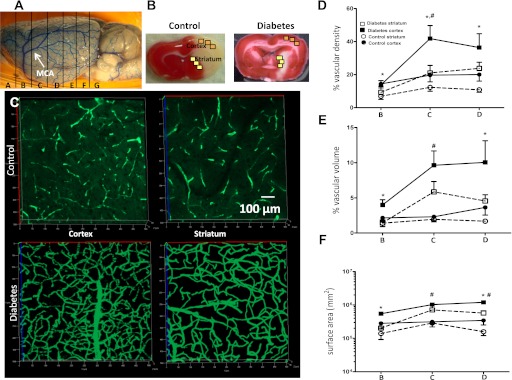
FIG. 1.
Comparison of cerebral vascularization and its spatial distribution in control and diabetic GK rats. Different brain regions (A) and ROIs (B) where angiogenic parameters were assessed. C: Representative FITC-perfused cerebrovascular images from control and diabetic rats showing differences in angiogenesis in the cerebral cortex and striatum. D–F: Significant differences in vascular density (D), volume (E), and surface area (F) were observed between the cortex and striatum in both control and diabetic groups; however, diabetic rats exhibited a more than twofold increase in vascular density in the ROI in C and D. E and F: Vascular volume and surface area were markedly increased in both the cortex and striatum of the diabetic group compared with controls. *P < 0.01 cortex vs. striatum; #P < 0.05 diabetes vs. control. Data are means ± SEM, n = 4–11. (A high-quality digital representation of this figure is available in the online issue.)

