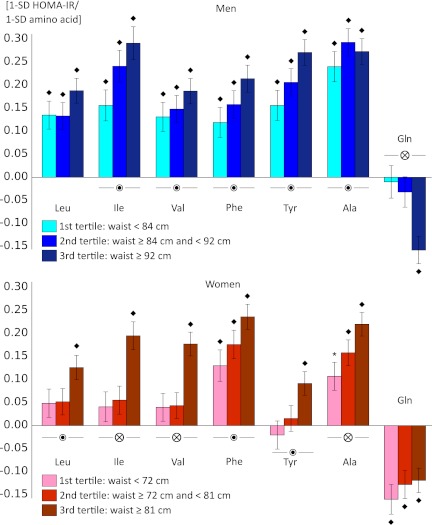
FIG. 1.
Associations of amino acids with HOMA-IR across tertiles of waist circumference for men and women. Linear regression and ANCOVA models were adjusted for age and waist circumference, total cholesterol, HDL cholesterol, and triglycerides. Association magnitudes are in units of 1-SD increased HOMA-IR per 1-SD increase in amino acid level, and error bars indicate SE. Associations were meta-analyzed for the two cohorts (n = 7,098). *P < 0.05; ♦P < 0.0005 for association of amino acid with HOMA-IR.  P < 0.05; ⊗P < 0.0005 for amino acid × waist interaction, indicating different slopes across tertiles of waist circumference.

