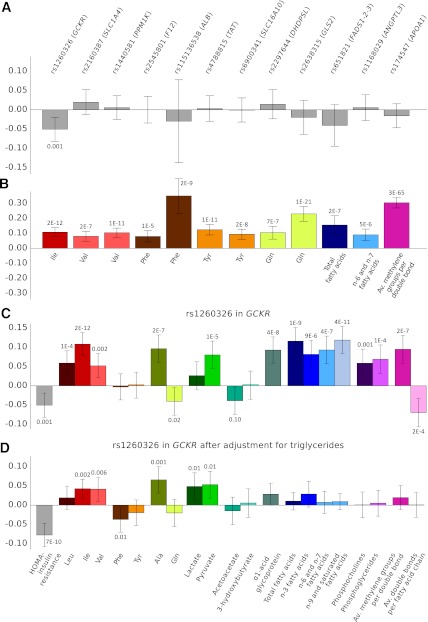
FIG. 3.
Associations of genetic variants regulating metabolite levels with HOMA-IR (A) and the strongest circulating metabolite measure (B). Associations for rs1260326 in GCKR with the metabolites before (C) and after (D) adjustment for triglycerides. Error bars indicate 95% CIs and numbers indicate P values of association. All associations were adjusted for sex, age, waist, and population structure and meta-analyzed for the two cohorts (n = 6,343). Association magnitudes are in units of 1 SD HOMA-IR or metabolite concentration per allele copy. Av., average.

