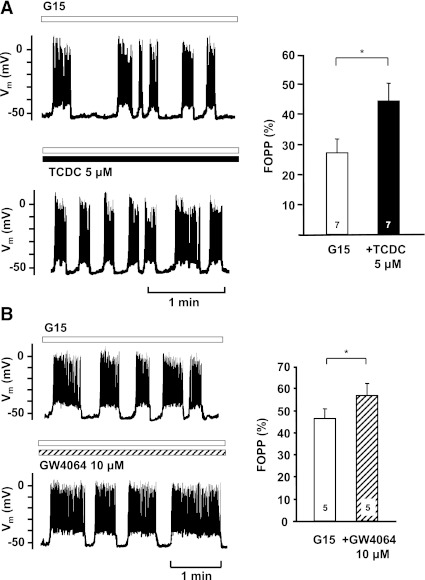
FIG. 4.
Effects of FXR activation on Vm. A and B: Effects of TCDC and GW4064 on the fraction of plateau-phase FOPP. FOPP was calculated at a time interval of 5 min before and during addition of the drugs. To obtain regular oscillations, these experiments were performed with 20 mmol/L Ca2+ in the bath solution. Left: typical experiment; bottom: continuation of the top trace. Right: summary of all experiments. The diagrams show evaluation of the FOPP in the presence of 15 mmol/L glucose (G15, white bars) and in the presence of G15 + TCDC (black bar in A) or G15 + GW4064 (hatched bar in B). n is given within each bar. *P ≤ 0.05.

