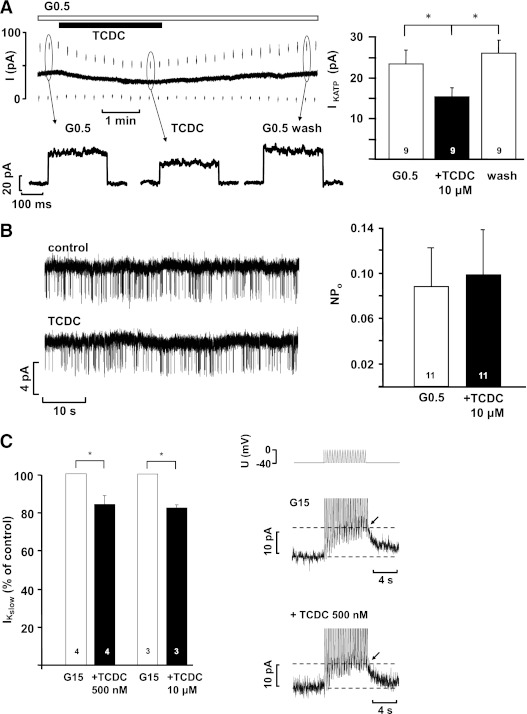
FIG. 6.
A: KATP whole-cell current measured in the perforated-patch configuration in the presence of 0.5 mmol/L glucose and after addition of TCDC. The lower dashed line indicates zero current at −80 mV. At the marked time points, whole-cell currents are shown in higher resolution below the current trace. B: KATP single-channel activity registered in excised inside-out patches. Representative experiments at left. The diagrams at right summarize the data. n is given within each bar. C: Reduction of IKslow by TCDC. The pulse protocol used for these experiments is illustrated above the current traces. White bars: Control condition, glucose concentrations as indicated. Black bars: Respective glucose concentration + TCDC. In the current traces, the peak of IKslow is marked by the arrows. The diagram at left summarizes the data. n is given within each bar. *P ≤ 0.05.

