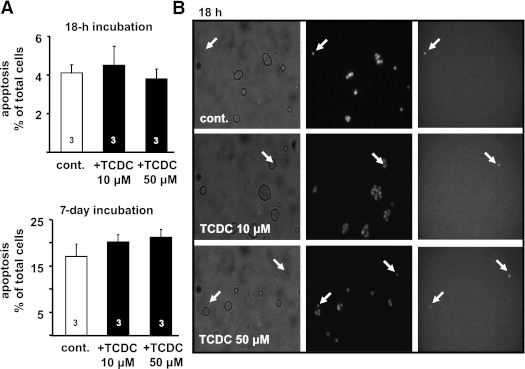
FIG. 8.
Effect of TCDC on apoptosis. A: The bars summarize the results for TUNEL-positive cells without (cont., white bars) and with treatment with TCDC (black bars) for 18 h and 7 days in medium with 11.1 mmol/L glucose. B: Images of islet cells after 18-h incubation. Transmitted light (left); 380-nm excitation wavelength, nuclei staining with Hoechst dye 33258 (middle); and TUNEL-positive cells (right) are shown. Fluorescence images were obtained at 480-nm excitation wavelength. Arrows denote dead cells. n is given within each bar.

