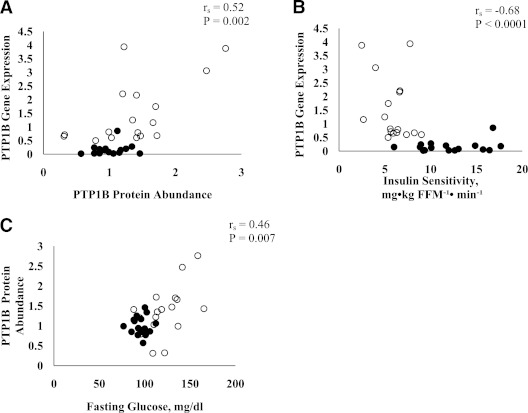
FIG. 2.
Relationship of PTP1B gene expression to PTP1B protein abundance (A) and insulin sensitivity (B). Relationship of PTP1B protein abundance to fasting glucose (C). PTP1B gene expression and protein abundance values are expressed as arbitrary units. Unadjusted values are presented. Black circles, no diabetes; white circles, type 2 diabetes.

