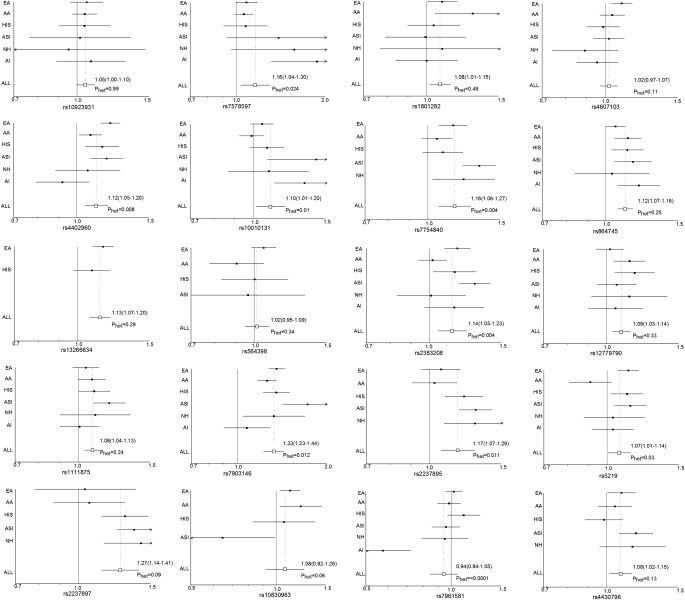
FIG. 1.
Forest plots for each risk variant. Shown are the effect estimates (squares) and 95% CIs (bars) for each variant by population, as well as overall (hollow square). AA, African American; HIS, Hispanic; AI, American Indian; ALL, random-effects meta-analysis of all populations;ASI, East Asian; EA, European American; NH, Native Hawaiian; Phet, test for heterogeneity across populations.

