
Figure 2. Analysis of methylation in CB-iPSC, K-iPSC, ESC, and somatic cells.
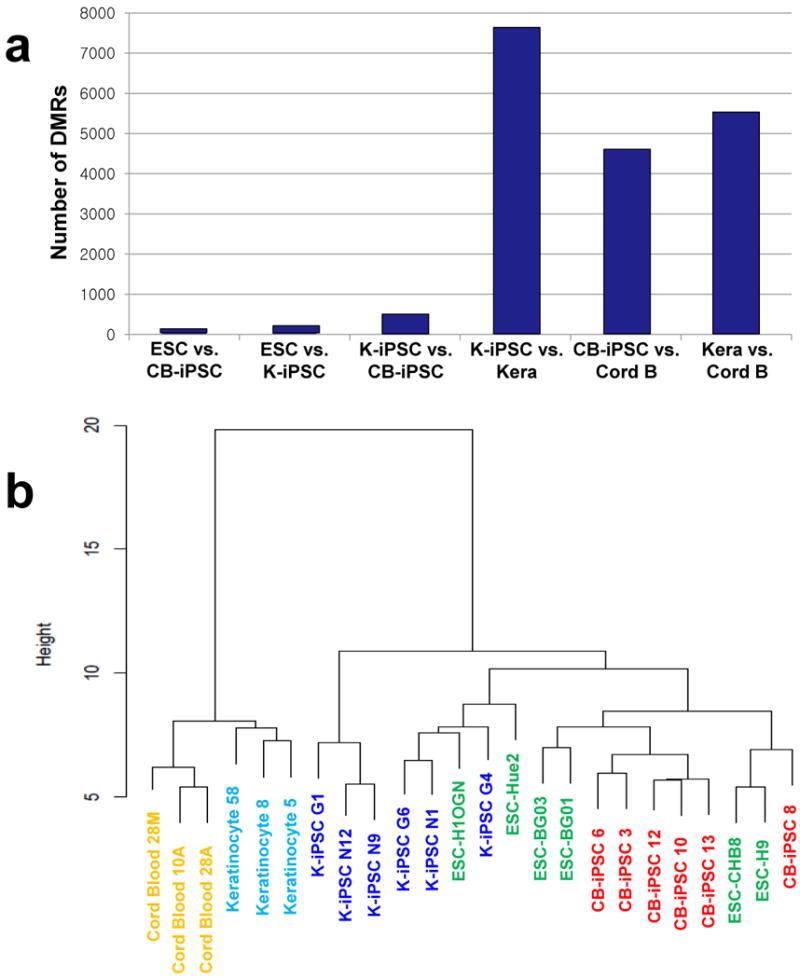

(a) Numbers of differentially methylated regions (DMRs) between CB-iPSC, K-iPSC, ESC, umbilical cord blood, and cultured keratinocytes. DMRs were defined by an area cutoff of 2.0. (b) Cluster dendrogram analysis using the top 1,000 most variable probes across all samples. (c, d) Gene enrichment analysis of DMRs. Blue histograms represent a probability distribution of the number of genes predicted to overlap DMRs by chance. Red vertical lines indicate the observed number of genes that overlap DMRs. (c) Genes differentially methylated between CB-iPSC and K-iPSC are enriched in DMR-associated genes (genes both differentially expressed and methylated between cord blood and keratinocytes). (d) Genes highly expressed in keratinocytes are enriched in DMRs that are both hypermethylated in K-iPSC relative to CB-iPSC and are located in gene bodies rather than promoters.