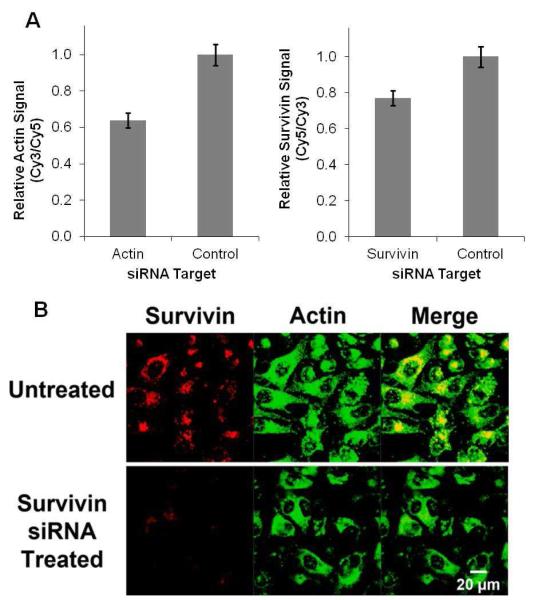
Figure 3.
Detection of actin and survivin mRNA expression in cells. Survivin-Cy5 and Actin-Cy3 flares were used. (A) In order to change the relative levels of survivin and actin mRNA the cells were treated with either actin or survivin targeted siRNA. Nonsense siRNA with no target in the cells was used as a negative control. The cell associated fluorescence intensities corresponding to each flare were measured by flow cytometry. (B) In a similar experiment, survivin levels were reduced using siRNA and the change in fluorescence from the multiplexed nano-flares was measured and assessed qualitatively by fluorescence confocal microscopy.

