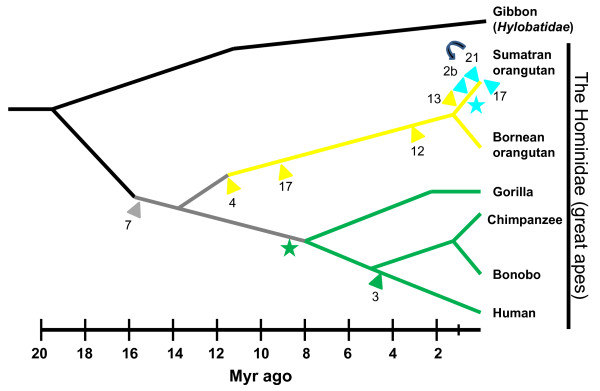
Figure 3.
A schematic of predicted Alu insertion events illustrated on a primate evolutionary tree from gibbon (a small ape) to the great apes. The estimated evolutionary time period is shown on the scale at the bottom in millions of years (Myr). The gray arrowhead depicts the basal Alu insertion event on chromosome 7 shared among the great apes. The yellow arrowheads represent the approximate time period, based on nucleotide divergence and allele frequencies of offspring Alu insertion events specific to the orangutan lineage. The aqua star represents the emergence of a daughter Alu subfamily, based on diagnostic mutations, and the aqua arrowheads correspond to subsequent offspring Alu insertion events. The green star represents the approximate time period when the chromosome 7 parent element acquired two additional CpG and one non-CpG nucleotide substitutions shared by human, chimpanzee and gorilla (green lines). The green arrowhead denotes a subsequent human-specific Alu insertion event sharing these three variants. The numbers at the base of the arrowheads indicate the chromosomal locations. The curved arrow between insertions on 2b and 21 (Sumatran-specific polymorphic Alu insertions) indicates an alternative order of insertion.

