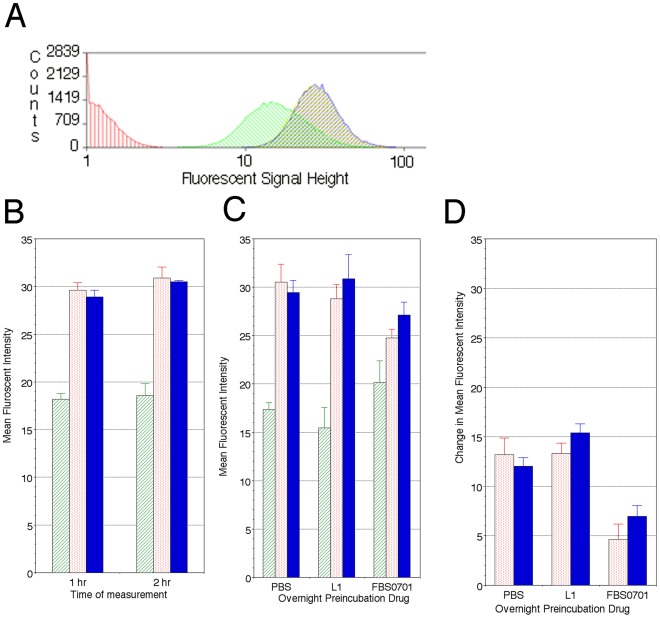
Figure 6. FBS0701 treatment chelates intracellular erythrocytic iron to the same extent as deferiprone but unlike deferiprone, removes iron from erythrocytes.
Aliquots 1–5×10⁶ erythrocytes from two separate healthy donors were stained in the dark with 0.125 µM calcein-AM for 15 minutes at 37°C. Cells were washed twice with PBS and allowed to rest for 10 minutes at 37°C in the dark. Flow cytometry on FACS- Calibur records fluorescent signal height of calcein on 40,000 cells. A. Calcein-AM fluorescence histograms of unstained (no calcein) erythrocytes (red) and calcein-stained erythrocytes (green) followed by incubation without (green) or with iron chelator L1 (blue) or FBS0701(yellow) show an increase in fluorescent signal intensity with iron chelator indicating displacement of labile iron from calcein. The L1 and FBS0701 peaks overlap. B. Washed erythrocytes after calcein-AM staining were incubated with PBS (green hatched bars), 100 µM L1(-deferiprone) (red dotted bars) or 100 µM FBS0701 (blue solid bars) chelator for 1 hr or 2 hr. Both chelators were able to enter erythrocyte and chelate iron once bound to calcein to increase MFI. C. Erythrocytes were incubated with PBS, 100 µM L1 (deferiprone) or 100 µM FBS7010 chelator for 1 hr and washed twice with PBS and incubated overnight in PBS. Erythrocytes were then washed, stained with calcein-AM and incubated with either L1 (red dotted bars) or FBS0701 (blue solid bars). The baseline calcein fluorescence in FBS0701 pre-treated cells was higher indicating a lower concentration of labile iron in these erythrocytes, while baseline MFI in cells incubated with deferiprone have is essentially unchanged. D. Change in Mean Fluorescent Intensity is shown for each of the conditions described in C. In the FBS0701 pre-treated cells, the addition of 100 µM of either chelator resulted in a change in MFI of 5 compared to a change of 15 in cells treated with either PBS or deferiprone. The data in B was performed in three replicates on RBCs from a single blood donor while C and D was performed using RBCsfrom two different donors each in triplicate and mean and standard deviation (SD) of the 6 data points is shown. Student’s t-test shows a statistical significant difference in the change in MFI for both iron chelators and PBS in B and C. In C, baseline FBS0701 MFI is higher than both PBS and deferiprone (p<0.05)and in D the change in MFI with FBS0701 after the overnight pre-treatment is less than with PBS and deferiprone (student’s t-test, p<0.005).

