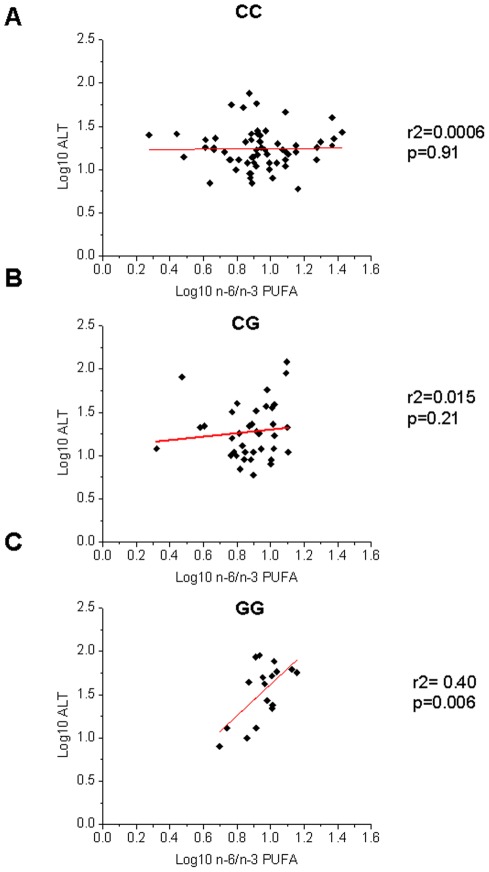
Figure 2. Interaction between PNPLA3 rs738409 and n-6/n-3 PUFA in modulating ALT levels.
The figure shows a different degree of regression between ALT (log10) and n-6/n-3 PUFA (log10) in the three genotypes. In the CC (Panel A) and CG (Panel B) group there was no association between ALT and n-6/n-3 PUFA (r2 = 0.0006, p = 0.91 and r2 = 0.015, p = 0.21 respectively). Only in the GG group (Panel C) there was a strong association between HFF% and n-6/n-3 PUFA (r2 = 0.40, p = 0.006).

