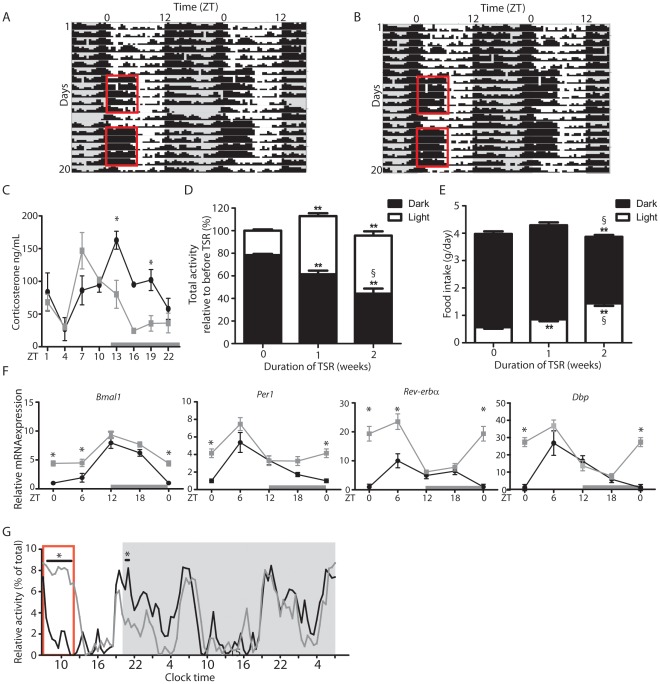
Figure 1. TSR results in perturbations of diurnal behavioral rhythms.
(A and B) Representative activity recordings of TSR mice. Actograms are double-plotted. Grey shadings indicate dark phases, red boxes indicate period of TSR. (C) Plasma corticosterone in control and TSR mice on Day12 of TSR (n = 3−5). (D) Distribution of light and dark activity during TSR expressed as % of total activity of the same set of animals during control conditions (n = 5 cages of 4 mice each), * indicates p<0.05 and **p<0.01 relative to 0 weeks of TSR, § indicates p<0.05 relative to 1 week of TSR. (E) Food intake during light and dark phase during TSR, * indicates p<0.05 and **p<0.01 relative to 0 weeks of TSR (n = 10−23), § indicates p<0.05 relative to 1 week of TSR determined by 2-way ANOVA. (F) Quantitation of clock gene mRNA by ISH in the SCN of control and TSR mice expressed relative to controls at ZT0 (n = 3 at each time point). (G) Activity of control and TSR mice upon release into DD (n = 3 cages). Grey bars indicate dark phase, red box indicates last period of gentle handling. Control mice represented by black lines, TSR mice by grey lines; * indicates p<0.05 determined by 2-way ANOVA.

