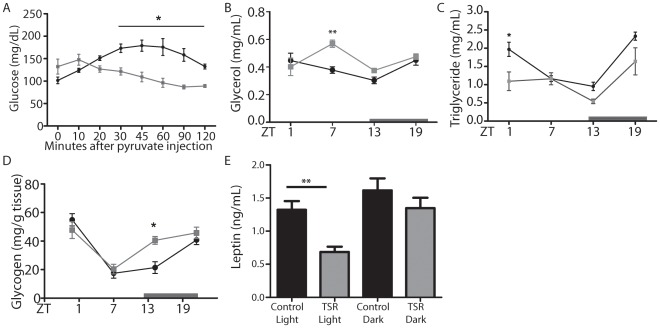
Figure 5. Metabolic effects of TSR.
(A) Pyruvate tolerance test in control and TSR mice (n = 5). Circulating glycerol (B) and triglyceride (C) rhythms in control and TRS mice (n = 3 at each time point). (D) Liver glycogen levels in control and TSR mice (n = 3 at each time point) (E) Leptin levels during light and dark phase in control and TRS mice (n = 10). Control mice are represented by black lines, TSR mice by grey lines; * indicates p<0.05 and **p<0.01 determined by 2-way ANOVA.

