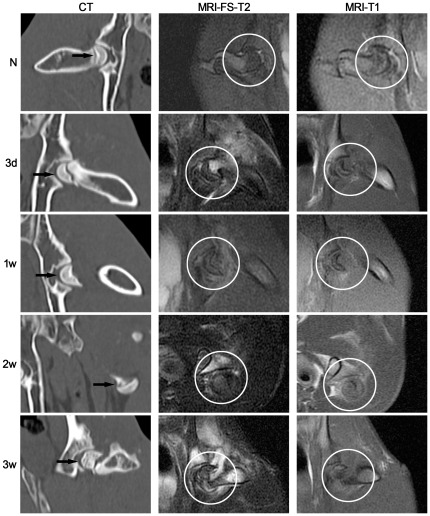
Figure 1. Conventional CT and MR examination of the traumatic ONFH rabbit model established in this study.
Left column: Conventional CT examination (coronal reconstruction). With progression of the disease, the density of cancellous bone became more heterogeneous and eventually lost its symmetry. Arrows indicate the femoral head. Middle column: MR-FS T2-weighted imaging (coronal plane) detected a signal that became increasingly uneven for up to 2 weeks after trauma. A signal with high intensity was observed at the fracture line, suggesting edema was present in the bone marrow. Right column: MR T1-weighted imaging (coronal plane) detected a loss of normal signal within the femoral head. Circles indicate the femoral head. N: normal group; 3 d, 1 w, 2 w, 3 w: 3 days, 1 week, 2 weeks, 3 weeks post-trauma, respectively.

