
Figure 8.
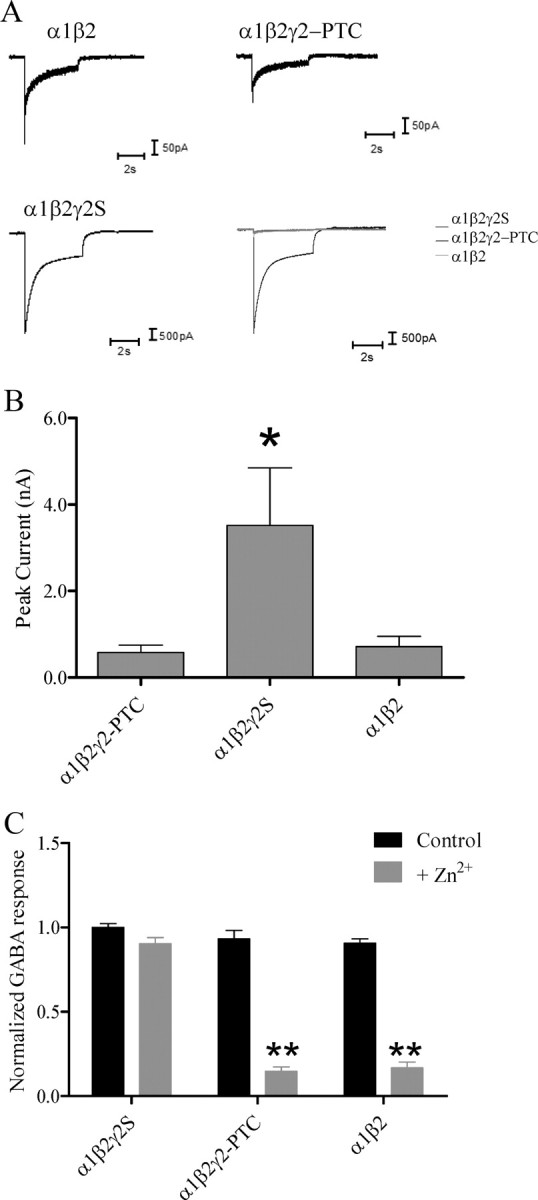
GABA-evoked currents recorded from cells coexpressing α1, β2, and γ2-PTC subunits were similar to those obtained with expression of α1and β2 subunits. A, GABAergic currents were recorded from coexpressed α1β2, α1β2γ2-PTC, and α1β2γ2S subunits. The merged picture showed the relative peak amplitude of currents recorded from α1β2γ2-PTC subunits was much smaller than that from α1β2γ2S subunits, but close to those obtained from α1β2 subunits. B, Peak current amplitudes from wild-type and mutant receptors were plotted. *p < 0.05, one-way ANOVA with Bonferroni's multiple-comparison test. C, The currents recorded from coexpressed α1β2γ2-PTC subunits had a Zn2+ sensitivity that was similar to that of coexpressed α1β2 subunits. Cells expressing α1β2γ2S, α1β2γ2-PTC, or α1β2 subunits were exposed to two 1 mm GABA applications 4 s apart or one 1 mm GABA application followed by 10 μm Zn2+ washed 4 s and 10 μm Zn2+ with 1 mm GABA application. The peak currents ratio of each cell was plotted. **p < 0.01, compared with the control conditions (two-way ANOVA with Bonferroni's multiple-comparison test). Error bars indicate SEM.