Figure 9.

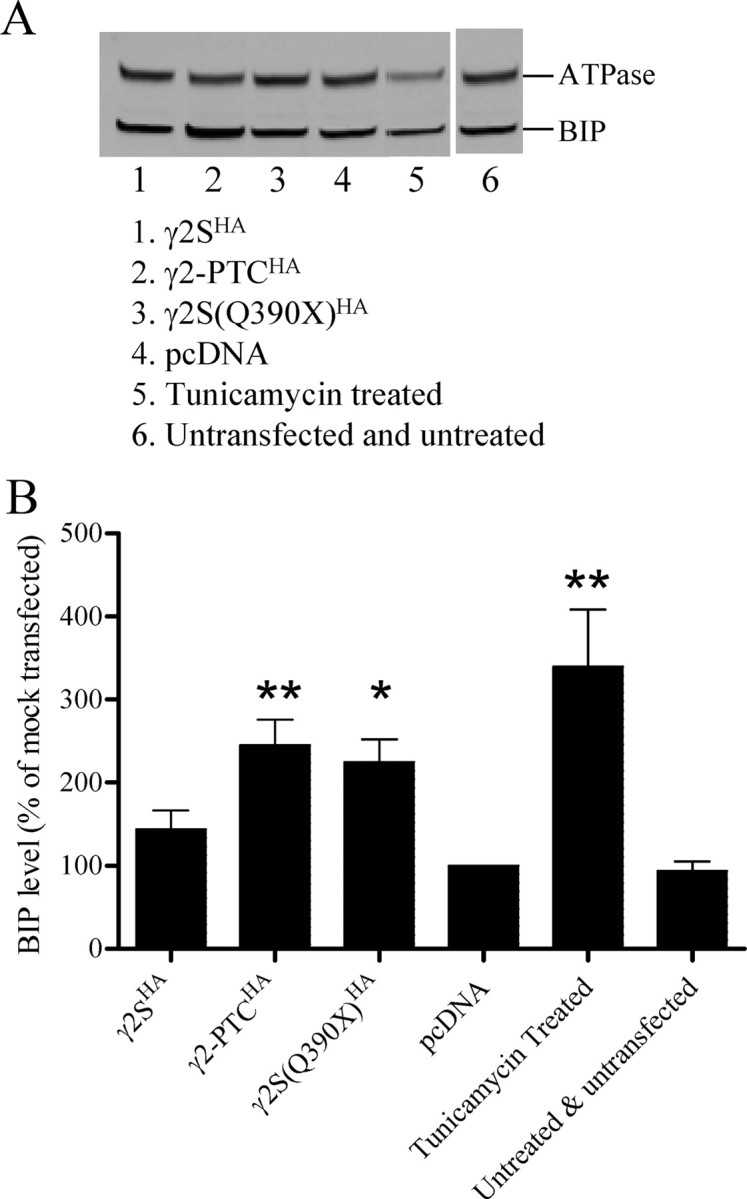
The γ2-PTC subunits induced an increase in the ER stress marker BIP. A, BIP protein levels in γ2HA subunit-transfected cells or tunicamycin-treated cells were evaluated. HEK293T cells were either transfected with 3 μg of γ2SHA, γ2-PTCHA, or γ2S(Q390X)HA subunit cDNA, or were treated with 1 μm tunicamycin for 3 h. Total proteins were collected and analyzed with Western blot detecting ATPase and BIP (n = 5). B, The band intensities of BIP and ATPase protein bands were quantified using Odyssey, version 3.0, software. The BIP intensity of each condition was normalized to ATPase band intensity. The normalized BIP band intensities were plotted. **p < 0.01 and *p < 0.05, compared with the normalized BIP level obtained from either pcDNA mock-transfected cells or untreated and untransfected cells (one-way ANOVA with Bonferroni's multiple-comparison test). Error bars indicate SEM.
