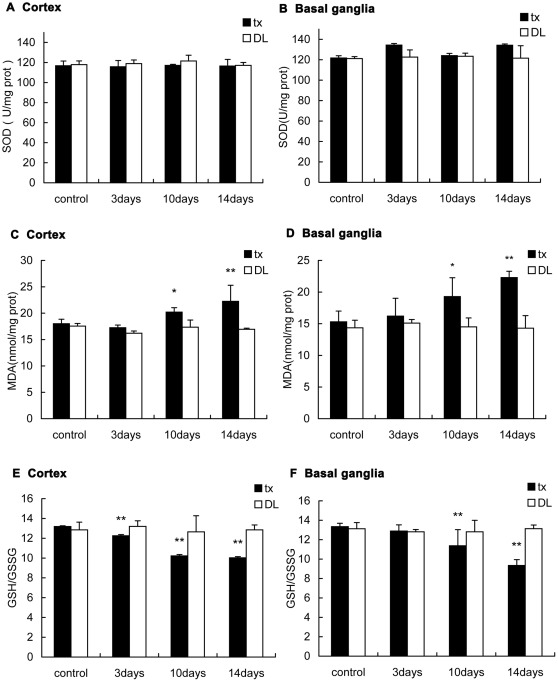
Figure 12. Oxidative-stress-related biomarkers assay in the cortex and the basal ganglia of the mice.
(A)(B)SOD activity did not show change in tx or DL mice during the administration. (C)(D) MDA concentrations slightly increased during PA administration in the cortex and basal ganglia of tx mice but not in DL mice. (E)(F)GSH/GSSG ratios decreased gradually along the administration in the cortex and basal ganglia of tx mice, but not in DL mice. (* P<0.05; ** P<0.01).

