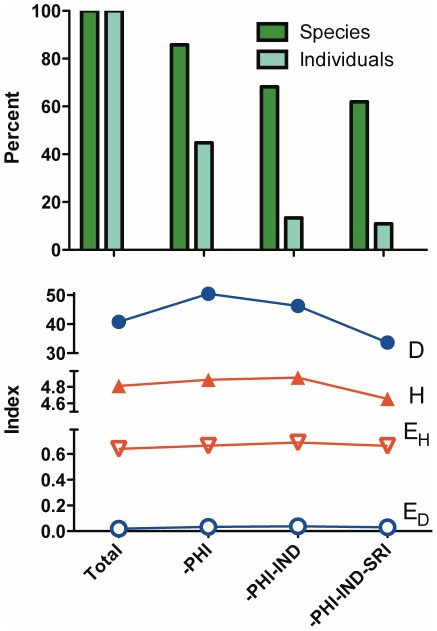
Figure 3. Percent Change and Diversity from Major Exporters of Marine Aquarium Fish.
Top - The percent change in the number of species (black bars), and the number of individuals or marine tropical fish imported into the United States in 2005 as the most important countries, the Philippines, Indonesia, and Sri Lanka, are removed from the total. Bottom - The change in diversity (Shannon H, and Simpson D) and evenness as the same three countries are removed.

