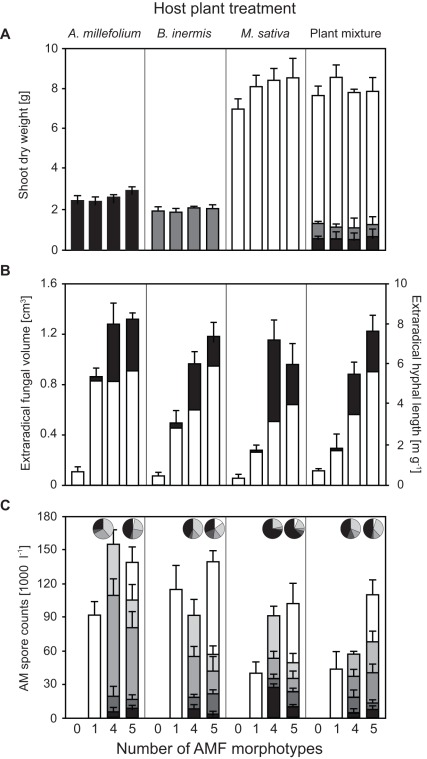
Figure 3. Effects of AMF inoculation and host plant treatments in Experiment 2.
a) Total shoot dry weight, b) total estimated extraradical fungal volume (white: proportion of extraradical hyphal volume, black: total AMF spore volume), and c) spore abundance (number of AMF spores) of the different AMF morphotypes; for morphotypes-mixtures bars were stacked by phylogenetic distance from G. irregulare (white): G. mosseae (light grey), G. etunicatum (grey), S. heterogama (dark grey), and G. gigantea (black). The total dry weights of the three plants species monocultures are differently shaded in a). Pie charts in c) indicate relative total spore volume of morphotype mixtures. Error bars are SEM.

