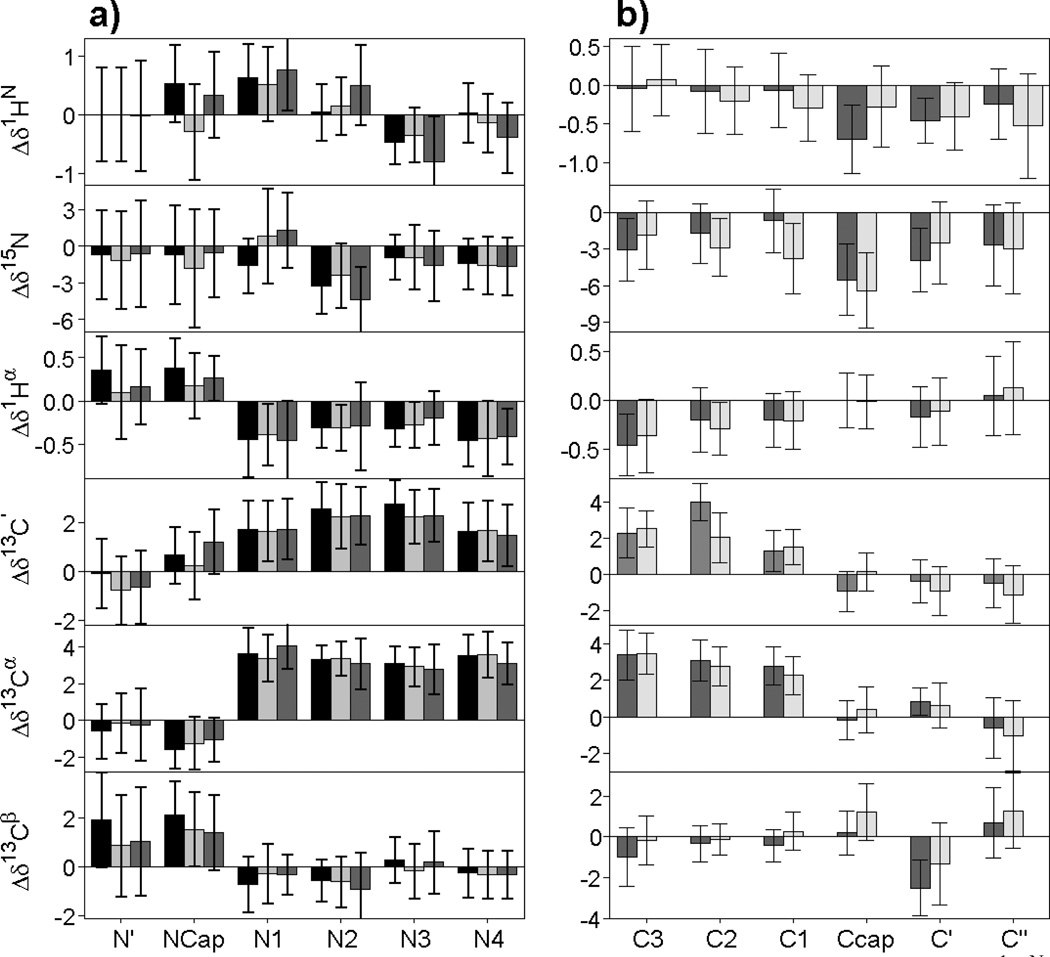
Fig. 4.
Chemical shift patterns of helix capping motifs. (a) The average secondary 1HN, 15N, 1Hα, 13C’, 13Cα and 13Cβ chemical shifts are plotted for each of the six consecutive residues (N′, Ncap, N1, N2, N3 and N4, respectively, with the Ncap box motif in black, the bb(i)→sc(i+3) Ncap motif in dark gray, and the sc(i)←bb(i+3) Ncap motif in light gray. (b) Average secondary chemical shifts for each of the six consecutive residues (C3, C2, C1, Ccap, C′, and C″, respectively) involved in a Schellman (dark gray) or αL (light gray) C-terminal helix capping motif.

