Fig. 1.
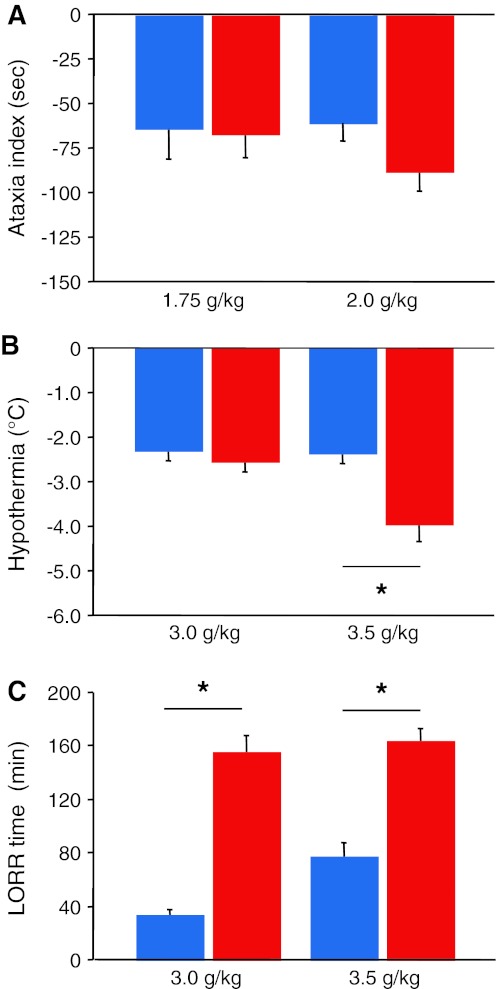
Trait differences between parental strains. a S1 (red bars) and B6 (blue bars) mice did not differ in ataxia responses to either 1.75 or 2.0 g/kg EtOH. b S1 had a significantly greater hypothermia response than B6 to a 3.5- but not a 3.0-g/kg EtOH dose. c S1 had significantly longer LORR responses than B6 to either a 3.0- or a 3.5-g/kg EtOH dose. *P < 0.05. Data are mean ± SEM (colour figure online)

