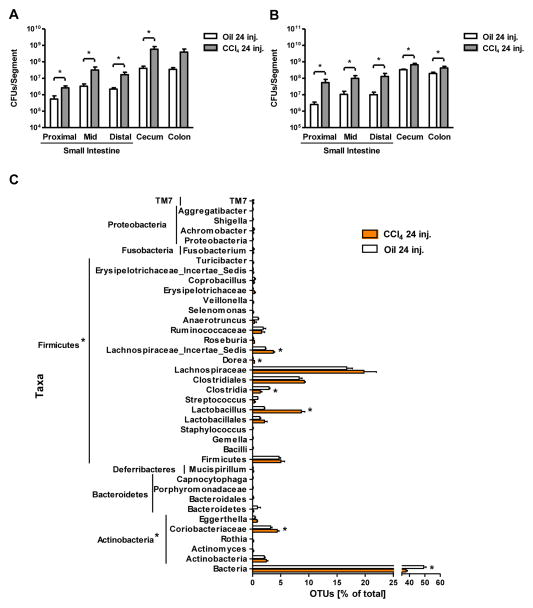
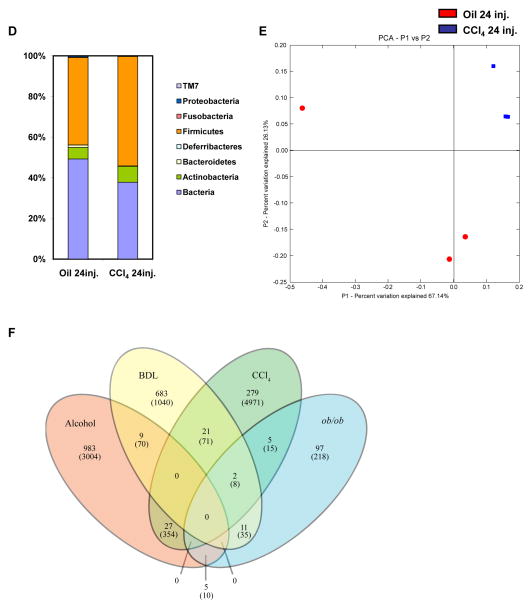
Figure 4. Effects of carbon tetrachloride on microbial diversity of the mouse cecum.
Mice were injected intraperitoneally with oil or carbon tetrachloride (CCl4) for a total of 24 times. (A and B) Luminal and adherent bacterial load was determined by aerobic (A) and anaerobic (B) cultures in various gastrointestinal segments (n=4–15). (C) 16S rRNA gene surveys show clustering of specific operational taxonomic units (OTUs) by treatments. Orange bars indicate OTUs containing the CCl4 group (3 mice, distributed among 823 OTUs) and white bars indicate OTUs containing the oil control group (3 mice, distributed among 563 OTUs). (D)The graph demonstrates the percentages of each community contributed by the indicated phyla. (E) Principal coordinates analysis (PCoA) was performed on weighted and normalized P1 vs. P2 UniFrac distances for the oil and the CCl4 group. The CCl4 samples are in blue while the oil samples are in red. CFU = colony forming unit. *p<0.05.(F) Venn Diagram of sequenced animals (cecal microbiome) is shown, which depicts the distribution of OTUs (and reads in parenthesis) that remain after subtracting any OTU containing a control group read. Mice were fed alcohol or an isocaloric diet as control via an intragastric feeding tube for 3 weeks [23], underwent BDL or sham operation for 10 days, or were injected 24 times with CCl4 or oil as control. Genetically obese ob/ob mice with fatty liver disease and their wildtype siblings were used as additional liver disease model [28].


