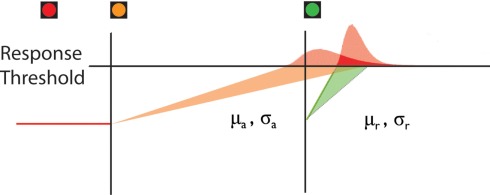
Figure 2.
Two-horse linear rise-to-threshold model of response time data in the Traffic Light task. Group and individual response time data were fit to a two-horse linear rise-to-threshold model. Response time distributions arise probabilistically from one of two linear rise-to-threshold processes, and the first process to reach the threshold (horizontal line) on a given trial will trigger a response: (1) An anticipatory decision process, triggered by the onset of the amber Traffic Light, with mean rate of rise μa and SD rate of rise σa. This process has a small mean rate of rise and large variance, and therefore results in a wide distribution of RTs, of which some are elicited prior to green. (2) A reactive decision process, triggered by the onset of the green Traffic Light, with mean rate of rise μr and SD rate of rise σr. This process has a high mean rate of rise and small variance, and therefore results in a narrow distribution of RTs with median shortly after green onset.

