Figure 1.
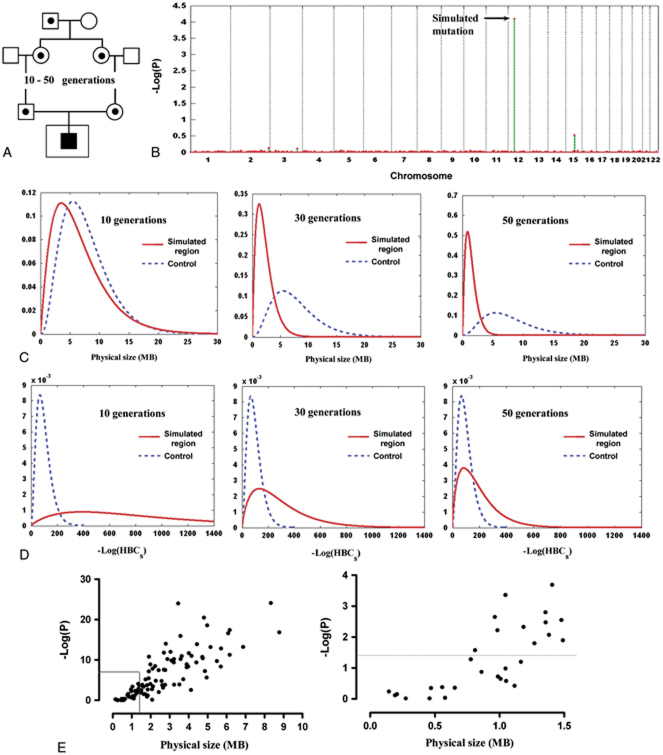
HRRA results on singleton patient cases. A: The simulation process. Shown is the process of generating the genotypes of the “affected” individual who inherits two copies of a recent ancestral allele. The data made available to HRRA are the genotypes of the singleton “affected” individual (inside the larger square) plus genotype data for control individuals. B: HRRA result on a representative simulated case. This case inherited two copies of a haplotype that is 30 generations in age and the P-value for this region ranks at the 50th percentile among all simulations. The y-axis is the −log of P-values generated through a simulation process and the x-axis is the chromosomal position. C, D: The distributions of the simulated homozygous regions and the best homozygous regions in the controls based on their physical length (C) or the −log of HBCs estimated by HRRA (D). The x-axis is MB (C) or −log(HBCs) (D) of the simulated haplotypes (solid line) aged 10 generations (left), 30 generations (middle), or 50 generations (right), and the best regions in the control individuals (dashed line). Calculation of the y-axis is based on a probability density function (gamma distribution) of the physical length (MB) or −log(HBCs) of the regions considered (see Supporting Information). E: Correlation between physical size and HRRA P-values. Left panel: overall correlation (R2=0.645); right panel: zoomed in on regions 1.5 MB and smaller. [Color figures can be viewed in the online issue, which is available at http://www.wiley.com/humanmutation.]

