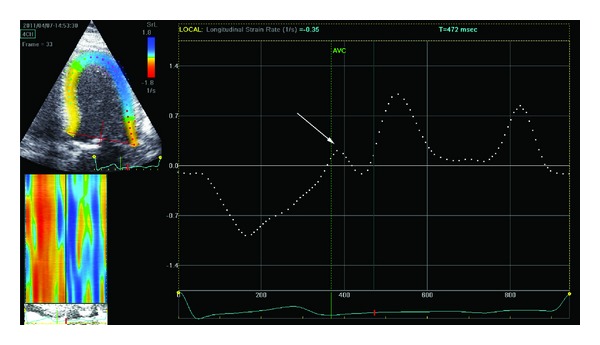
Figure 1.

Evaluation of peak strain rate during left ventricular isovolumetric relaxation period SRIVR from the apical 4-chamber view. First, a region of interest which includes the entire left ventricular wall is obtained (left-upper panel). The software consequently displays the changes in longitudinal strain rate over the cardiac cycle (white dotted line). Left ventricular isovolumetric relaxation occurs in diastole, starting immediately after closure of the aortic valve and terminating with the beginning of the diastolic early (E) wave. The peak strain rate value during the isovolumetric relaxation period (SRIVR) is consequently measured (indicated by the white arrow). The green dotted line indicates the timing of the aortic valve closure (AVC).
