
Figure 2.
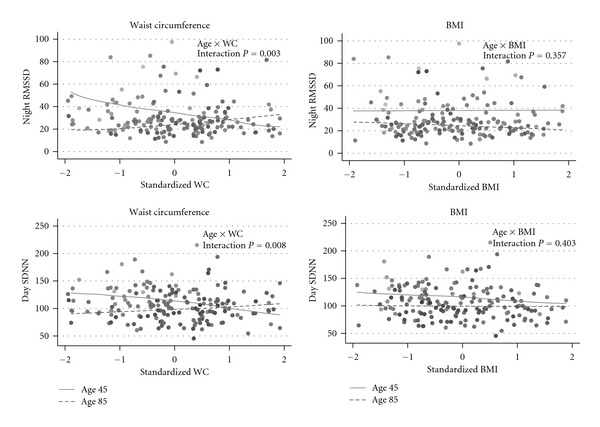
Data points are observed data; lines represent the predicted value of nighttime RMSSD (top row) and daytime SDNN (bottom row) (if the adiposity measure increased for an average participant at two ages: 45 years (solid lines) and 85 years (dashed lines)). Standardized waist circumference and standardized BMI are shown on x-axes to scale the measures similarly. The figures show differing relationships between waist circumference and HRV measures at young and old ages but not between BMI and HRV measures. Negative relationships were observed between waist circumference and RMSSD and SDNN in the 45 yo but no significant relationship in the 85 yo. Comparatively, the SDNN-BMI relationship is attenuated, compared to WC, for the 45-year olds and the RMSSD-BMI relationship is relatively flat at 45 and 85 years, with neither being statistically significant. *x-axes are standard deviations from mean waist circumference (women: 88 cm, men: 98 cm) or BMI (27 kg/m2). *Graded gray-scale data points from population illustrate increasing age (lighter is younger, darker is older, 26–96 y). Models were adjusted for sex, race, OGTT glucose, blood pressure, and the interactions age-by-sex, age-by-race, the sex-by-OGTT glucose. OGTT glucose = 2-hour oral glucose tolerance test glucose result; RMSSD:root mean square of successive differences; SDNN:standard deviation of N-N intervals.