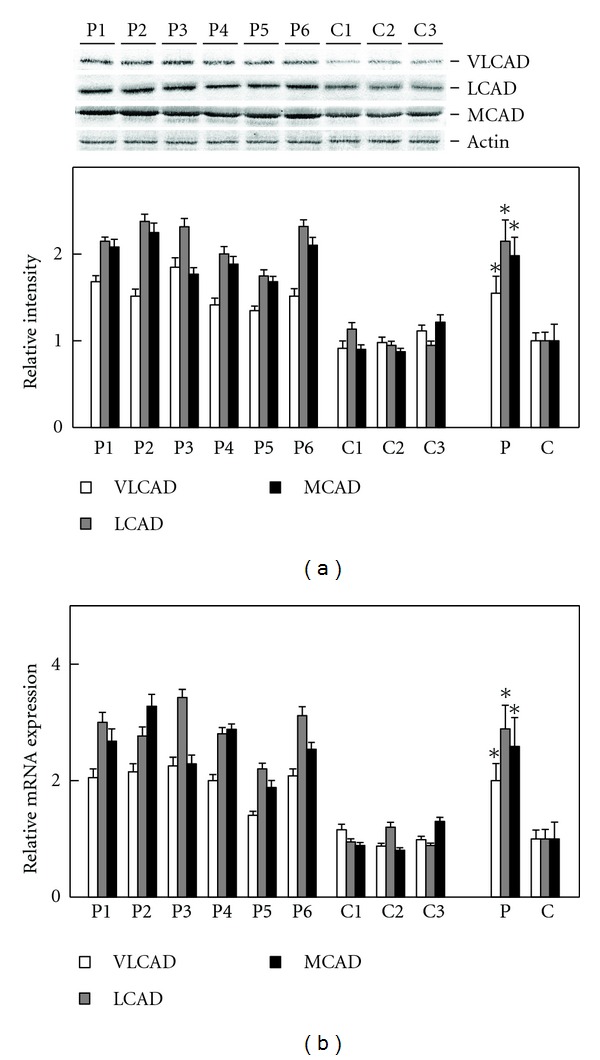
Figure 2.

Expression levels of three Species of acyl-CoA dehydrogenase. Assay methods were, respectively, described in Section 2. (a) Shows relative quantification of expression levels of three acyl-CoA dehydrogenases. Upper panel indicates protein bands in immunoblot analysis. The band of actin was used as the loading control. Lower panel indicates relative protein amounts obtained by immunoblot and densitometric analyses. (b) Shows relative mRNA expression. Open bar, VLCAD; gray bar, LCAD; closed bar, MCAD. P1–P6, individual patient's fibroblast; C1–C3, individual control fibroblast; P, means ± SD in six patients' fibroblasts; C, means ± SD in three control fibroblasts. *P < 0.05, versus controls.
