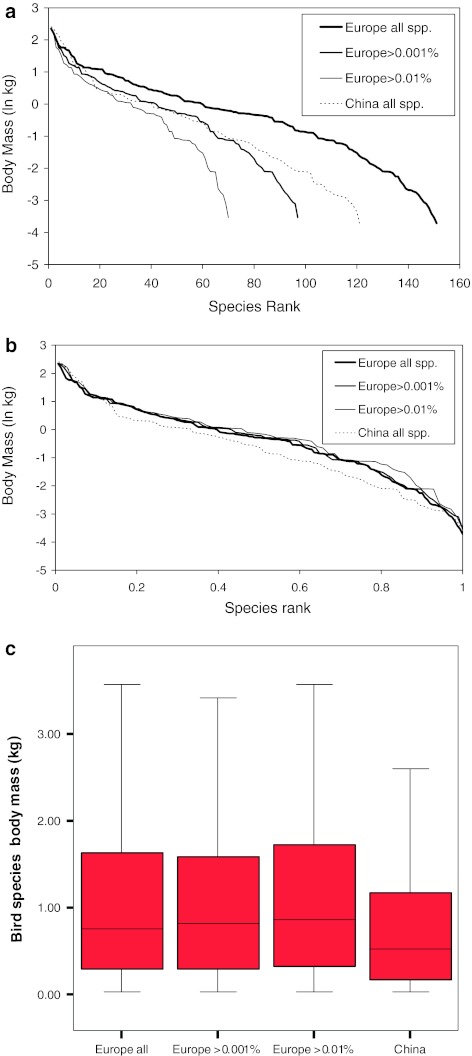
Fig. 1.
The relationship between species body mass and species rank ordered from high to low body masses. a For Europe, two extra curves are depicted with truncation of rare species that vary in their contribution to the total abundance (<0.01 and <0.001%) in order to depict the effect of the larger sample intensity in Europe. b Similar to a, but now with standardized species rank axis. c Distribution of the species’ body masses depicted in a box plot

