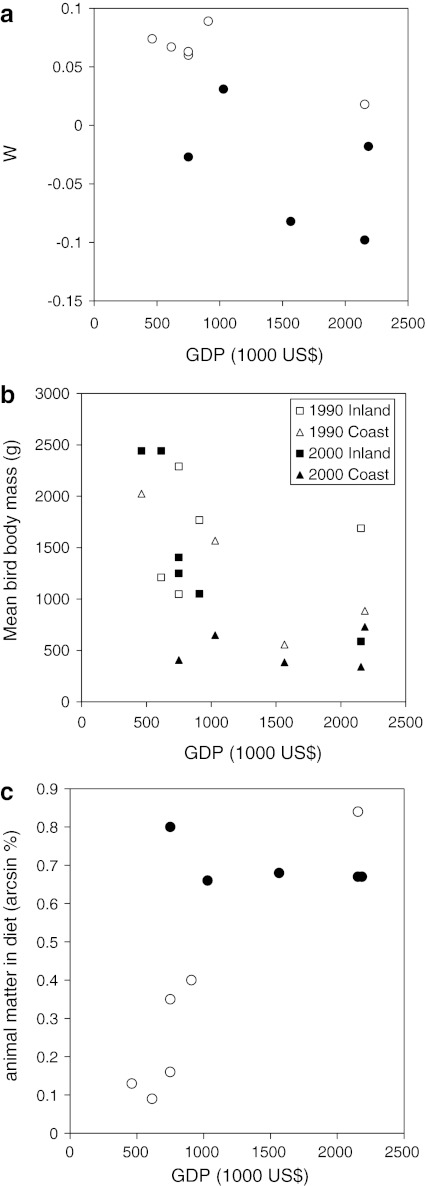
Fig. 3.
Relationship between a GDP (in million RMB for 2006) and W statistics, calculated from the ABC curves of the different provinces, for the coastal provinces (closed circles) and the inland provinces (open circles). b Relationship between GDP (in million RMB for 2006) and mean bird body mass calculated for each of the provinces in the China bird surveys for the 1990–1993 surveys (open symbols) and the 2000–2003 surveys (closed symbols), separating the inland counts (squares) from the coastal counts (triangles). c Effects of differences in GDP on the proportion of animal matter in the diet of waterbirds for the coastal provinces (closed circles) and the inland provinces (open circles)

