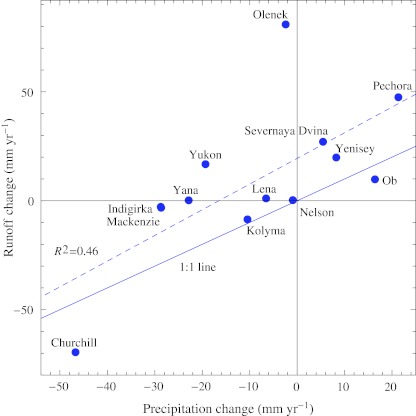
Fig. 3.
Changes from 1961–1990 to 1991–2002 in observed annual average precipitation and corresponding runoff for 13 major Arctic basins (Fig. 1). The solid line indicates a 1:1 change in precipitation and runoff. The dashed line is a linear best-fit regression of actual changes in all basins except the Churchill watershed, which is affected by major artificial water diversion

