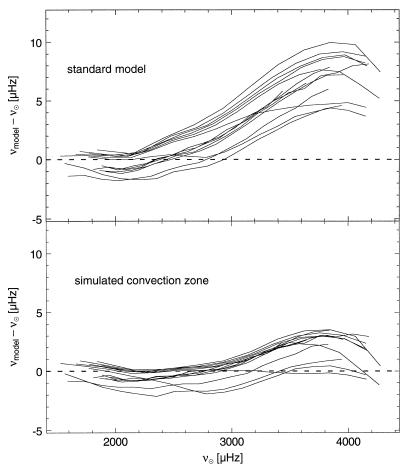
Figure 5.
Frequency difference diagrams (calculated minus observed) for solar p-modes with degree l in the range from 0 to 100. The upper panel shows a standard model constructed with the mixing length theory of convection, and the lower panel shows the same interior model with a more realistic simulated convection zone.

