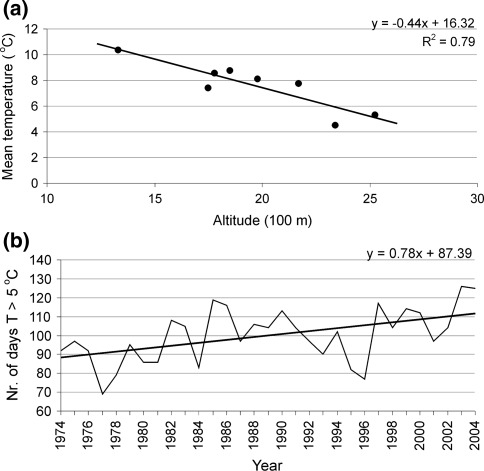
Fig. 5.
a Mean air temperature versus altitude for eight stations at >1000 m a.s.l. in the surroundings of the study site, derived from the daily temperature from April to September 1974–2004. The linear regression indicates an altitudinal lapse rate of −0.44°C/100 m. b The number of days with an air temperature >5°C at 2625 m a.s.l. (at the altitude of the potential treeline PT30)

