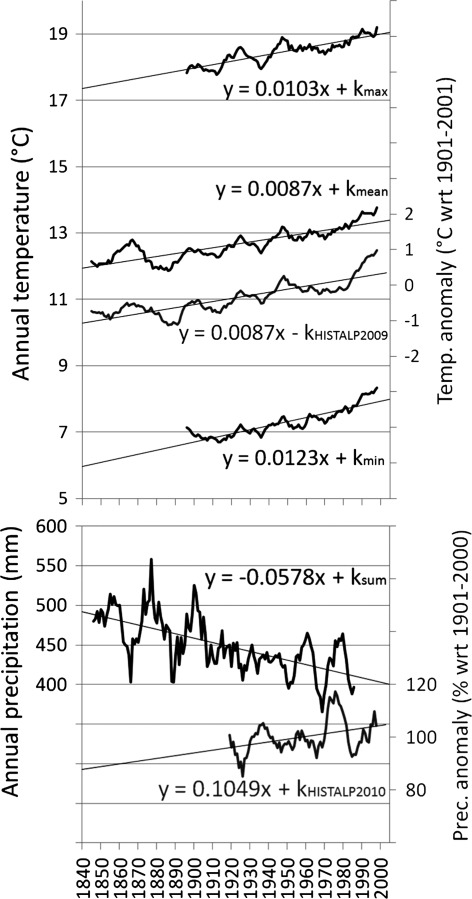
Fig. 6.
The mean annual temperature and annual precipitation sum presented as 11-year running means for Aosta (black) and for the grid point 45°N 7°E (grey); the original series are courtesy of the Società Meteorologica Italiana (Mercalli et al. 2003) and of the HISTALP project (Böhm et al. 2010; http://www.zamg.ac.at/histalp/), respectively. The regression lines for the mean temperatures are calculated on data referring to the common period 1840–2003

