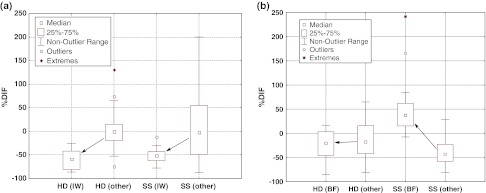
Fig. 2.
Percentage difference between sampling periods (2005 and 2008) in the concentrations for the elements a connected to the past ironworks atmospheric emissions (Co, Cr, Fe, Mn, Mo, W and Zn) and b connected to the brownfield contamination (As, Cd, Co, Cr, Cu, Fe, Mn, Mo, Pb and Zn). Data used to draw this figure were taken from Table 2. HD house dust, SS street sediment, BF two sampling points nearby brownfield, IWR two sampling points nearby ironworks, other the other sampling points (four points in both cases). Outliers and extremes are values outside of the following interval: [(P25 – k * (P75 − P25)), (P75 + k * (P75 − P25))], where k = 1.5 for outliers and k = 3 for extremes. P25 and P75 are the 25th and 75th percentile values

