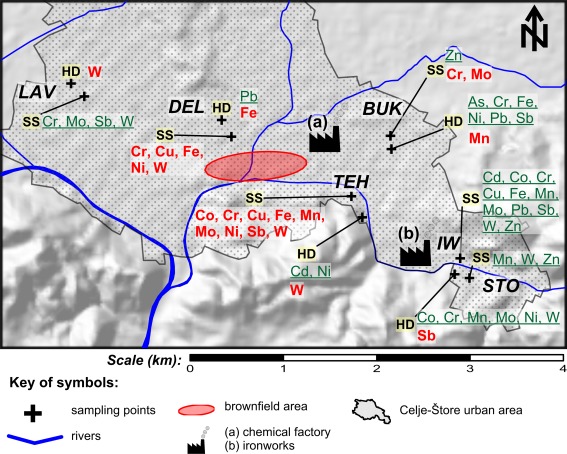
Fig. 3.
Spatial distribution of the significant decrease (in green, underlined) or significant increase (in red, bold) of elements in house dust and street sediment between the years 2005 and 2008. HD house dust, SS street sediment, BUK Bukovžlak sampling point, STO Štore sampling point, LAV Lava sampling point, DEL Delavska street sampling point, TEH Teharska street sampling point, NC Nova Cerkev sampling point, IW ironworks sampling point

