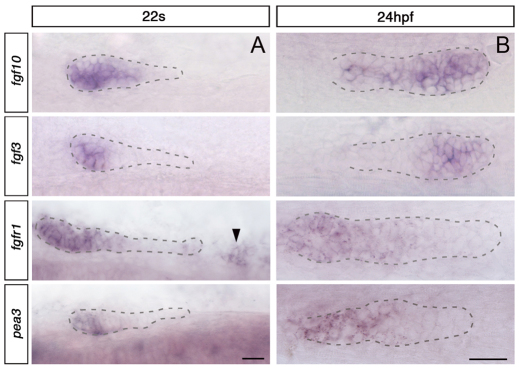
Fig. 4.
Expression pattern of Fgf signalling components before and after the fusion. (A) Expression of Fgf signalling components at 22s, before fusion. Main primordium is outlined with dashed lines; the black arrowhead indicates SPCs. Dorsal view. (B) Expression of Fgf components at 24 hpf, after fusion. The primordium fused with SPCs is outlined with dashed lines. Side view. Scale bar: 25 μm.

