Figure 1.

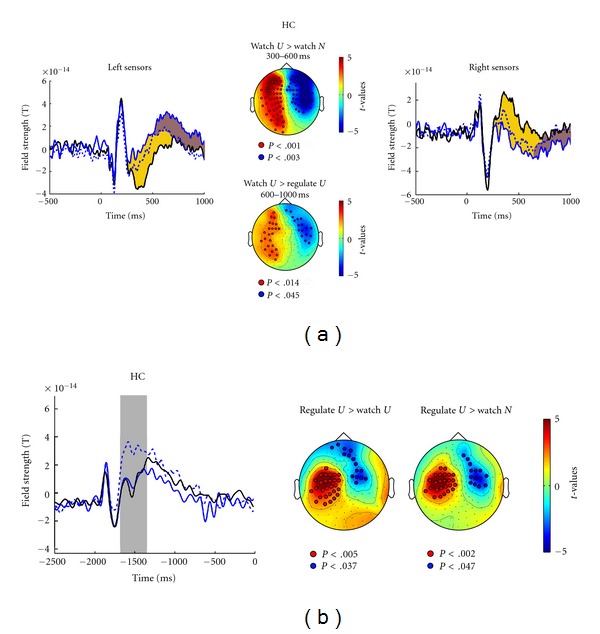
(a) Time course of field strength around picture onset at 0 ms for watch-neutral (solid black lines), watch-unpleasant (solid blue lines), and down-regulate-unpleasant conditions (dotted blue lines) for healthy control participants (HC). The left panel illustrates left-hemisphere sensors, the right panel right-hemisphere sensors. In- and outgoing magnetic fields explain the opposite direction of the effect. Periods during which conditions differ significantly are marked in yellow for watch-unpleasant versus watch-neutral (Emotion effect) and in brown for watch-unpleasant versus down-regulate-unpleasant (Instruction effect). The center panel presents t-maps projected onto a schematic top view (left = left) testing watch-unpleasant versus watch-neutral (Emotion effect) 300–600 ms after picture onset (top) and comparing watch-unpleasant versus down-regulate-unpleasant (Instruction effect) 600–1000 ms after picture onset (bottom). Sensors defining the significant cluster are marked by open circles). (b) Time course of field strength preceding cross cue onset (−2000 ms) to picture onset (0) ms for watch-neutral (solid black line), watch-unpleasant (solid blue line), and down-regulate-unpleasant (dotted blue line) conditions for HC group. The gray bar marks the epoch of significant differences between conditions. t-maps projected onto a schematic top view are plotted below, testing down-regulate-unpleasant versus watch-unpleasant conditions and testing down-regulate-unpleasant versus watch-neutral. Red and blue colors represent sensor clusters that show significant (P < .01) differences in field strength between conditions. Sensors defining the significant clusters are marked by open circles. The different direction of effects explains positive and negative t-values referring to the left (positive t-values, red) and right (negative t-values, blue) hemisphere ERF.
