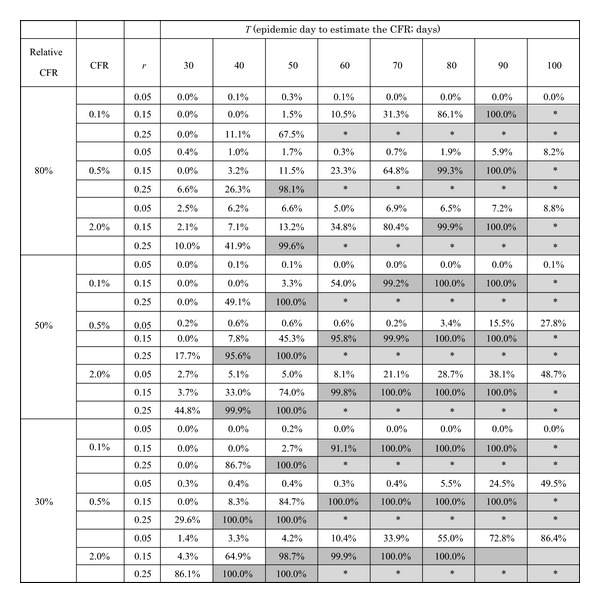
Table 2.
Proportion of simulation runs in which the upper 95% confidential interval of CFR (p) falls below specified cut-off values.

|
CFR: case fatality ratio (assigned value). Relative CFR: the ratio of assigned CFR value relative to the cut-off value. The proportion of successful simulation runs with the upper 95% confidence interval below the pre-specified cut-off value is shown. The parameter r is the exponential growth rate of infection (per day). T is the epidemic date on which the comparison is performed. Those exceeding the proportion of 90% are highlighted in dark grey, while the cells with *mark and shaded in light grey represent combinations of parameter values which generate too large numbers of cases and for which we refrained from estimation.
