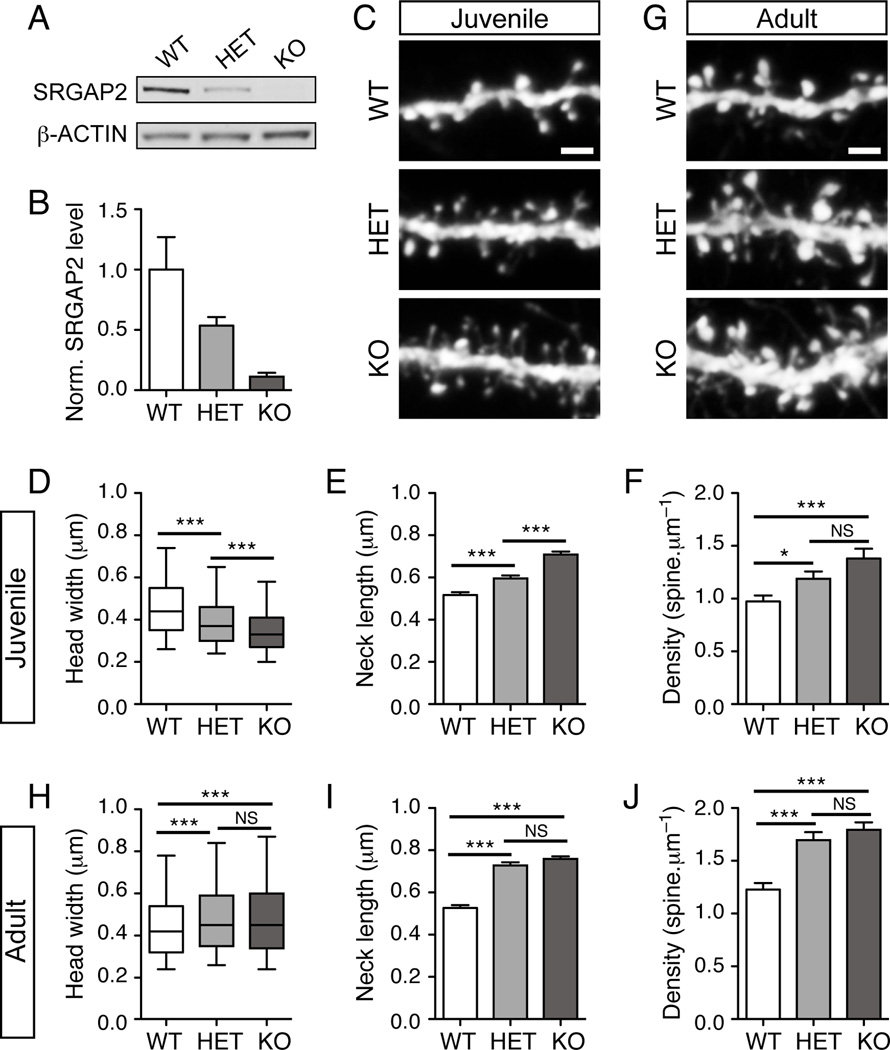
Figure 5. SRGAP2 deficiency delays spine maturation and increases spine density in vivo.
(A) Representative Western blot showing the relative amount of SRGAP2 in cortical lysates of wild-type (WT), heterozygous (HET) and knock-out (KO) mice.
(B) Quantification of SRGAP2 level in cortical lysates from 3 different animals per genotype normalized (norm.) to β-ACTIN and to the average SRGAP2 level in WT.
(C–F) Dose-dependent effect of SRGAP2 deficiency in juvenile mice (P18–P21). (C) Segments of oblique dendrites from WT, HET and KO mice expressing YFP in layer V pyramidal neurons (Thy1-YFP H line). (D) Distribution of spine head widths, nWT = 1278, nHET = 1307, nKO = 1602. (E) Mean spine neck length (± s.e.m). (F) Mean spine density (± s.e.m). nWT = 26, nHET = 20, nKO = 28.
(G–J) Long-term effect of SRGAP2 deficiency on dendritic spines. (G) Segments of oblique dendrites from adult (P65–P77) WT, HET and KO mice expressing YFP in layer V pyramidal neurons (Thy1-YFP H line). (H) Distribution of spine head widths in adult neurons, nWT = 1394, nHET = 1441, nKO = 2010. (I) Mean spine neck length in adult neurons (± s.e.m). (J) Mean spine density (± s.e.m). nWT = 23, nHET = 23, nKO = 35. Scale bars: 2 µm. ***p < 0.001, NS: p > 0.05, Mann-Whitney test.

