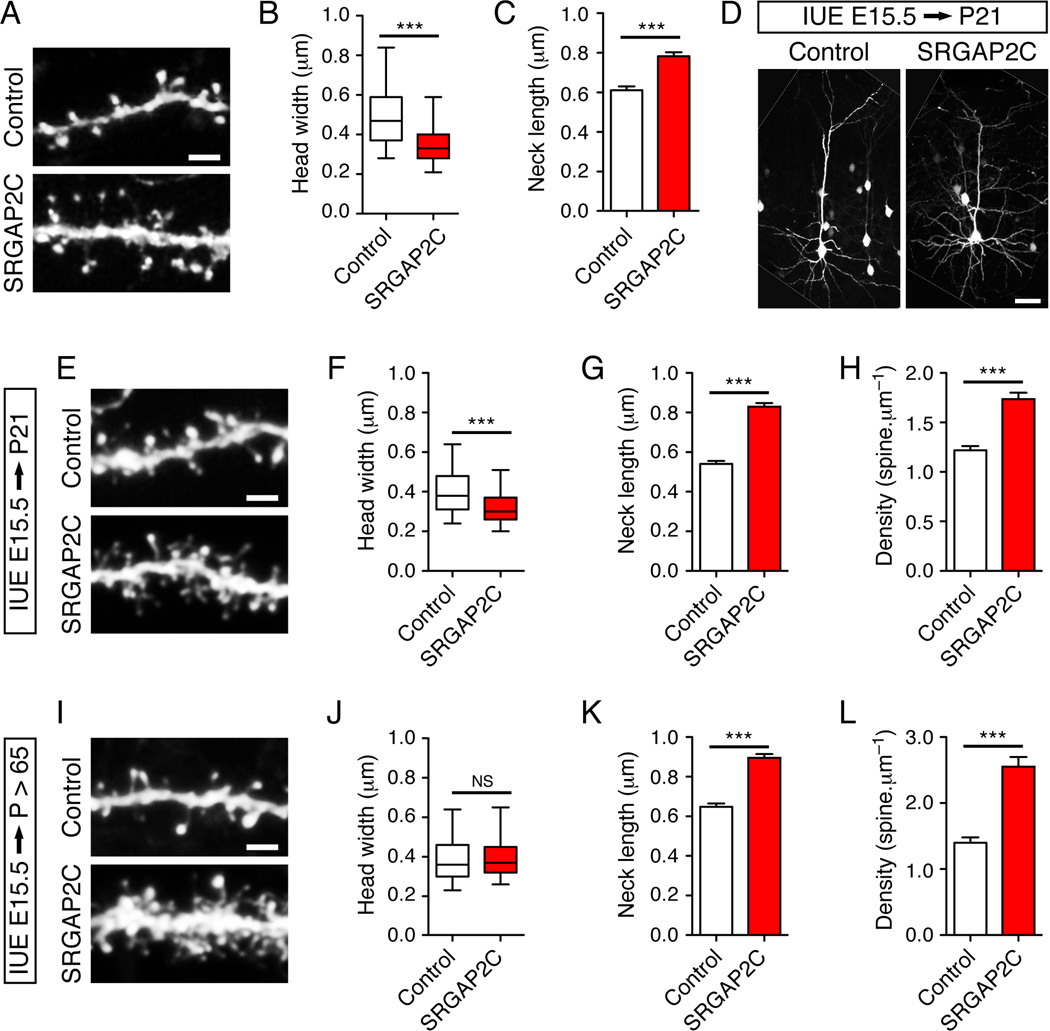
Figure 6. SRGAP2C expression in mouse cortical neurons phenocopies SRGAP2 deficiency in spines.
(A–C) SRGAP2C expression induces long thin spines in cultured cortical neurons. (A) Segment of dendrites from cortical neurons (20DIV) expressing EGFP alone (Control), or EGFP and SRGAP2C (SRGAP2C). Neurons were imaged 2 days after transfection. (B) Box plot representing the distribution of the width of spine heads. nControl = 907 (same as Figure 4F–H), nSRGAP2C = 1029. (C) Mean length of spine necks (± s.e.m).
(D–H) Effect of SRGAP2C expression in juvenile mice in layer 2/3 pyramidal neurons following in utero electroporation (IUE) at E15.5. (D) Representative layer 2/3 pyramidal neurons expressing a control cDNA (Control, left) or SRGAP2C (right) with a vector encoding mVenus. The white lines delineate the border of the original images. (E) Segments of oblique dendrites from neurons in the conditions described above. (F) Distribution of spine head widths, nControl = 1068, nSRGAP2C = 1167. (G) Mean spine neck length (± s.e.m). (H) Mean spine density (± s.e.m). nControl = 16, nSRGAP2C = 16. (I–L) Long-term effect of SRGAP2C expression on spines in adult mice. (I) Segments of oblique dendrites from control and SRGAP2C-expressing neurons after in utero electroporation at E15.5. (J) Distribution of spine head widths, nControl = 800, nSRGAP2C = 941. (K) Mean spine neck length (± s.e.m). (L) Mean spine density (± s.e.m). nControl = 14, nSRGAP2C = 12. Scale bars represent 2 µm in panels A, E and I and 50 µm in panel D. *** p < 0.001, NS : p > 0.05, Mann-Whitney test.

